Test draft sch f
$11
13 Feb 2026, 12:42
Neutral

Join Minipip Academy and access free courses in investing, trading, economics, and more.
Sign Up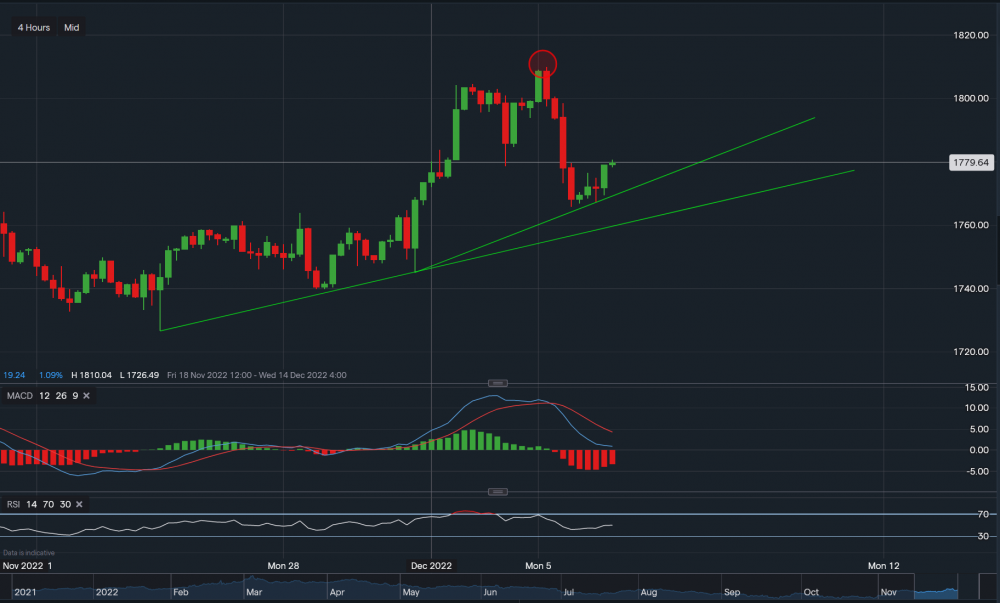
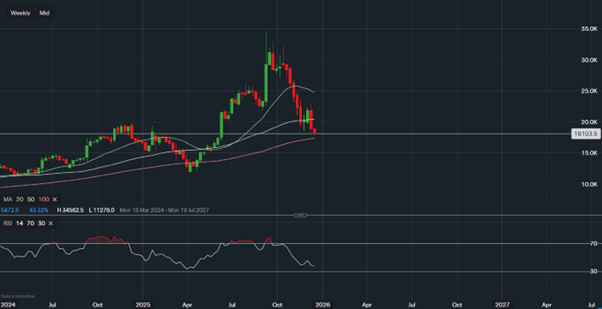
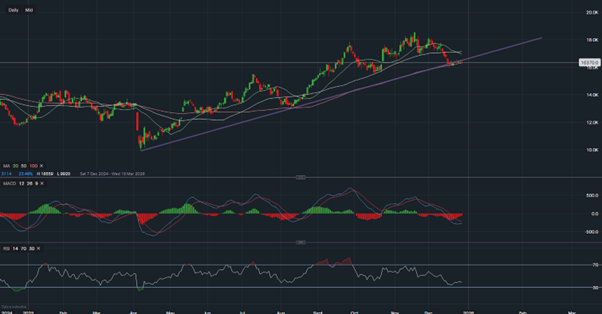
Gold - Chart & Data from IG
From a technical outlook, Gold is currently trading at $1779 an ounce. A small base of support seems to have been established after yesterday's heavy downfall. Support sits at $1774 then at $1772 (correspondent with the upper green trendline) then at $1765 (correspondent with the lower green trendline). A break below these points could see the price of Gold slip further towards $1745/$1750. Towards the upside, resistance sits at $1783. A break above this resistance point may see a reversal trend and head back up towards the $1800 an ounce price range. Looking at the indicators, MACD is currently negative but starting to level out and RSI is neutral as it reads 50.

Tradable assets:
Min.Deposit:
Max Leverage:
FCA:

Rating:
 Earnings Calendar
  Economic Calendar
  VAT Calculator
  Tax Free Childcare Calculator
 Percentage Calculator
 Compound Interest Calculator
  Loan Overpayment Calculator
 Mortgage Calculator
 Credit Card Calculator
 Investing
  Economics
 Trading
  Technical Analysis
  Personal Finance
 Calculator