Test draft sch f
$11
13 Feb 2026, 12:42
Neutral

Join Minipip Academy and access free courses in investing, trading, economics, and more.
Sign Up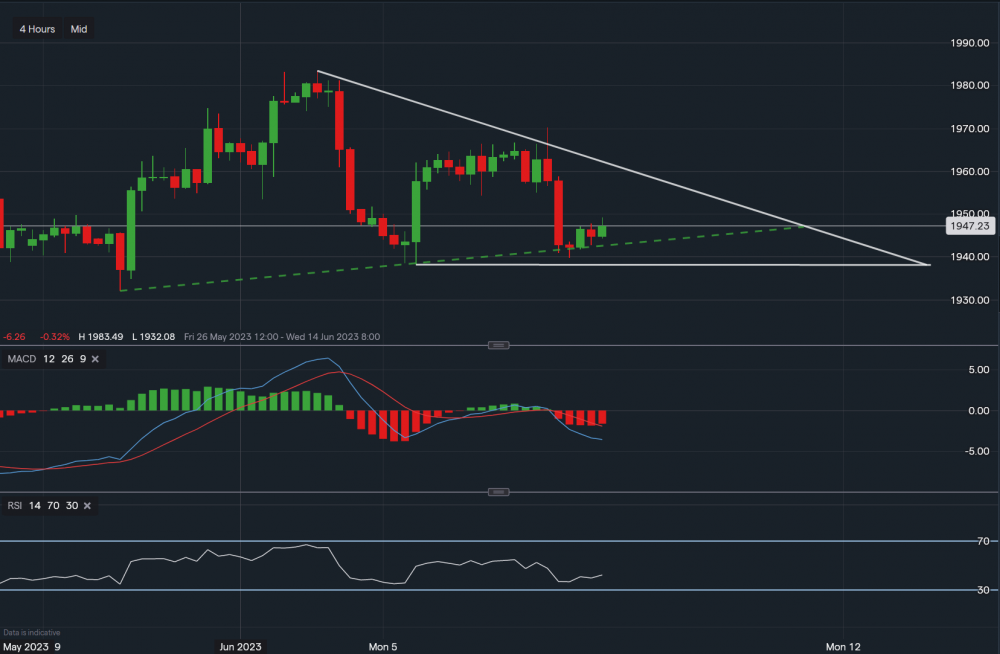
Chart & Data from IG
Gold is currently trading at around $1,947 an ounce. The price has created higher lows on two separate occasions since the 30th of May, one at $1,938 on the 5th of June and then at $1,939 on the 7th of June. This is highlighted by the ascending green trendline. A break below $1,938 could see the price slide lower towards $1,932. Towards the upside, resistance sits at $1,949 then at $1,957 (along the descending trendline of the triangle). A positive break out of the triangle may see the price of gold climb its way higher, with the target then of $1,965-$1,970 an ounce. Looking at the technical indicators, MACD is negative and the RSI is negative as it reads 41, but it’s rising.

Tradable assets:
Min.Deposit:
Max Leverage:
FCA:

Rating:
 Earnings Calendar
  Economic Calendar
  VAT Calculator
  Tax Free Childcare Calculator
 Percentage Calculator
 Compound Interest Calculator
  Loan Overpayment Calculator
 Mortgage Calculator
 Credit Card Calculator
 Investing
  Economics
 Trading
  Technical Analysis
  Personal Finance
 Calculator