Test draft sch f
$11
13 Feb 2026, 12:42
Neutral

Join Minipip Academy and access free courses in investing, trading, economics, and more.
Sign Up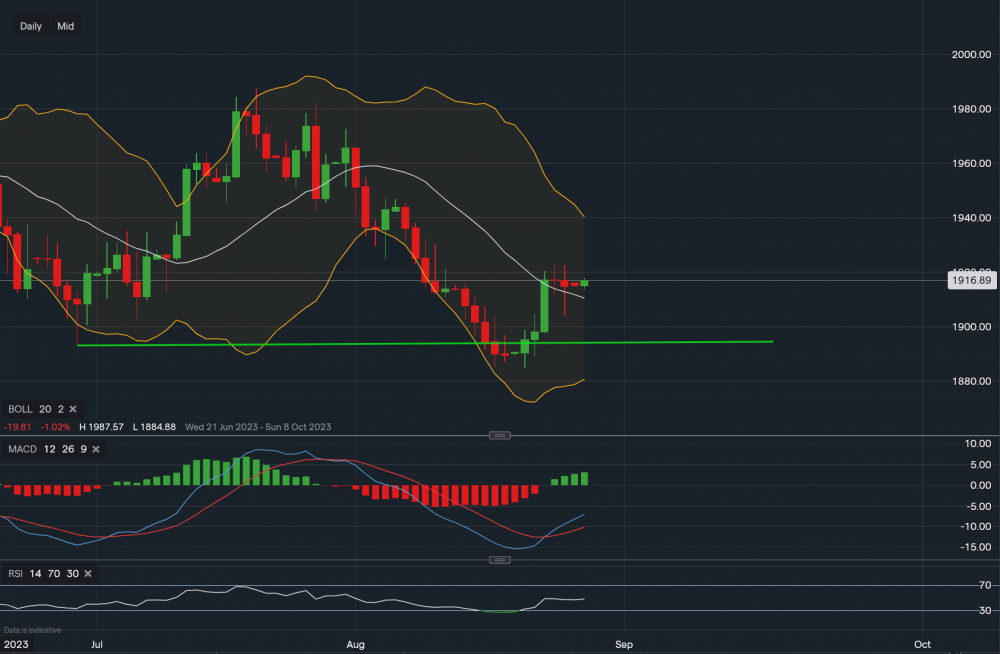
Chart & Data from IG
Taking a look at Gold as it seems to have consolidated around $1,884-$1,886, followed by a bounce higher last Wednesday. If we apply the Bollinger Bands on the daily timeframe, we can see the price has closed above the middle moving average at $1,917. Thursday, Friday and Sunday night have been flat, perhaps more consolidation with a slight pullback to the middle MA. This now may be a good opportunity for Gold to continue higher, we can see the first resistance at $1,923. A break above it could see a push higher towards $1,934 and then even the upper Bollinger Band, which currently reads $1,940. However, this is not guaranteed. Support now sits at $1,910 (middle MA) and then at $1,903 (Friday’s low), a break below $1,903 would indicate that more downside is possible with a move back towards the base of $1,893 (green trendline). Looking at the technical indicators, MACD is strongly positive and the RSI has now turned neutral as it reads 48.

Tradable assets:
Min.Deposit:
Max Leverage:
FCA:

Rating:
 Earnings Calendar
  Economic Calendar
  VAT Calculator
  Tax Free Childcare Calculator
 Percentage Calculator
 Compound Interest Calculator
  Loan Overpayment Calculator
 Mortgage Calculator
 Credit Card Calculator
 Investing
  Economics
 Trading
  Technical Analysis
  Personal Finance
 Calculator