Test draft sch f
$11
13 Feb 2026, 12:42
Neutral

Join Minipip Academy and access free courses in investing, trading, economics, and more.
Sign Up
Chart & Data from IG
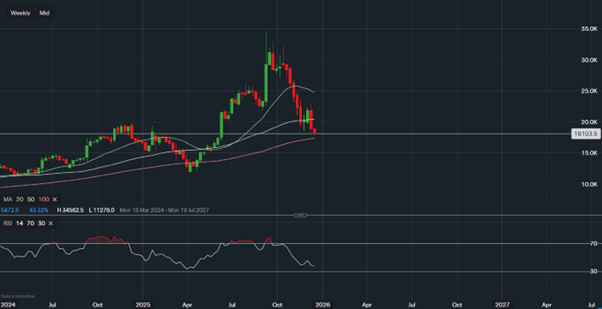
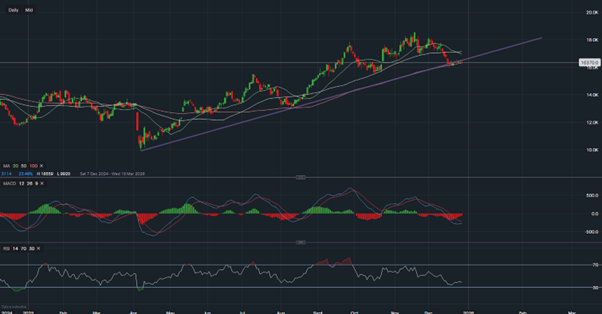
Taking a look at the sterling vs dollar pair after the Bank of England decided to keep rates at 5.25% for the second consecutive time. Currently, the forex pair is trading at around £1.2206, we can see that it has now approached the trendline resistance of £1.2186. The session is yet to finish, but a close above the trendline may be a bullish indication. In that case, we would look towards resistance levels sitting at £1.2288 and then at £1.2337. A break and close above £1.2337 would allow the bulls to eye up the £1.24-£1.25 area once again. However, false breakouts can occur, therefore, traders should be cautious when opening positions until more clarity is visible. Perhaps a move above the resistance of £1.2288. The previous resistance of £1.2186 shall now act as support, a move back below this level would then see support at £1.2143 and then at £1.2110. Looking at the technical indicators, the MACD remains in the positive tone with the RSI now on the rise as it reads 51.

Tradable assets:
Min.Deposit:
Max Leverage:
FCA:

Rating:
 Earnings Calendar
  Economic Calendar
  VAT Calculator
  Tax Free Childcare Calculator
 Percentage Calculator
 Compound Interest Calculator
  Loan Overpayment Calculator
 Mortgage Calculator
 Credit Card Calculator
 Investing
  Economics
 Trading
  Technical Analysis
  Personal Finance
 Calculator