Test draft sch f
$11
13 Feb 2026, 12:42
Neutral

Join Minipip Academy and access free courses in investing, trading, economics, and more.
Sign Up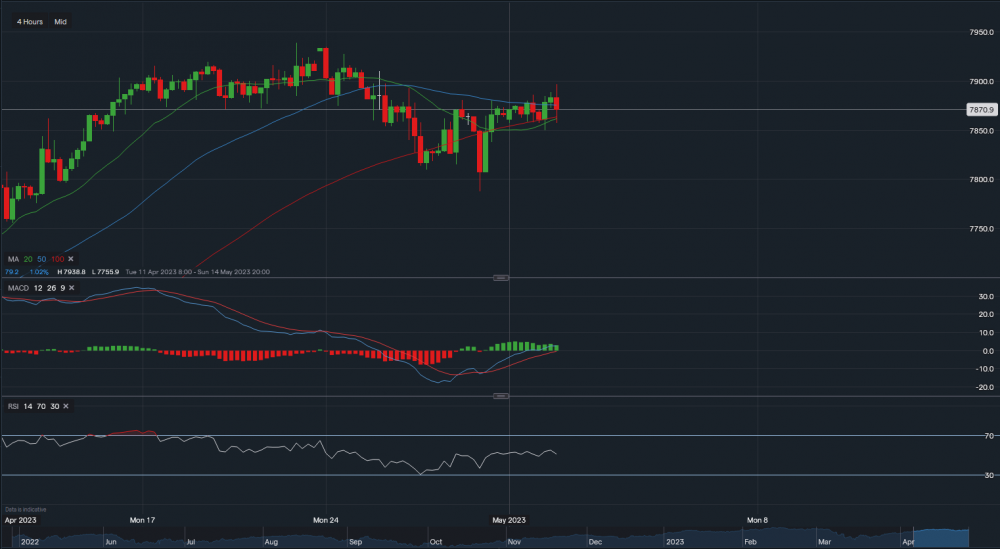
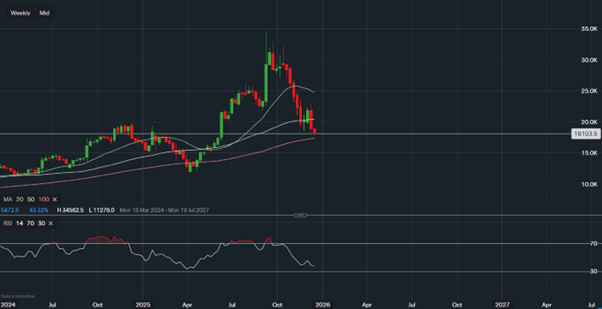
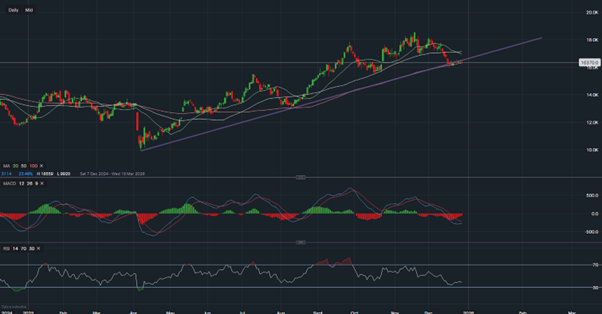
Chart & Data from IG
Taking a look at the FTSE 100 index after the recent earnings reports from oil giant BP and financial giant HSBC. Currently, the index is trading at around 7,870, it's in a pretty neutral stance at the moment as BP is down 5% and HSBC is up 5%. As both stocks make up a big chunk of the weighting within the index, the FTSE is struggling to move in either direction. Though there is support below at the 20 and 100-day moving averages (7,863), followed by 7850. A break below 7,850 may see the index fall further towards 7,815, and then even towards the major support sitting at 7,787. Towards the upside, resistance sits at the 50-day MA (7,875) followed by a tough point at 7,897. A break above 7,897 could see it rise higher with the target near its previous highs (7,915-7,930). Looking at the indicators, MACD remains slightly positive but RSI is now neutral as it reads 50.
 Earnings Calendar
  Economic Calendar
  VAT Calculator
  Tax Free Childcare Calculator
 Percentage Calculator
 Compound Interest Calculator
  Loan Overpayment Calculator
 Mortgage Calculator
 Credit Card Calculator
 Investing
  Economics
 Trading
  Technical Analysis
  Personal Finance
 Calculator