Test draft sch f
$11
13 Feb 2026, 12:42
Neutral

Join Minipip Academy and access free courses in investing, trading, economics, and more.
Sign Up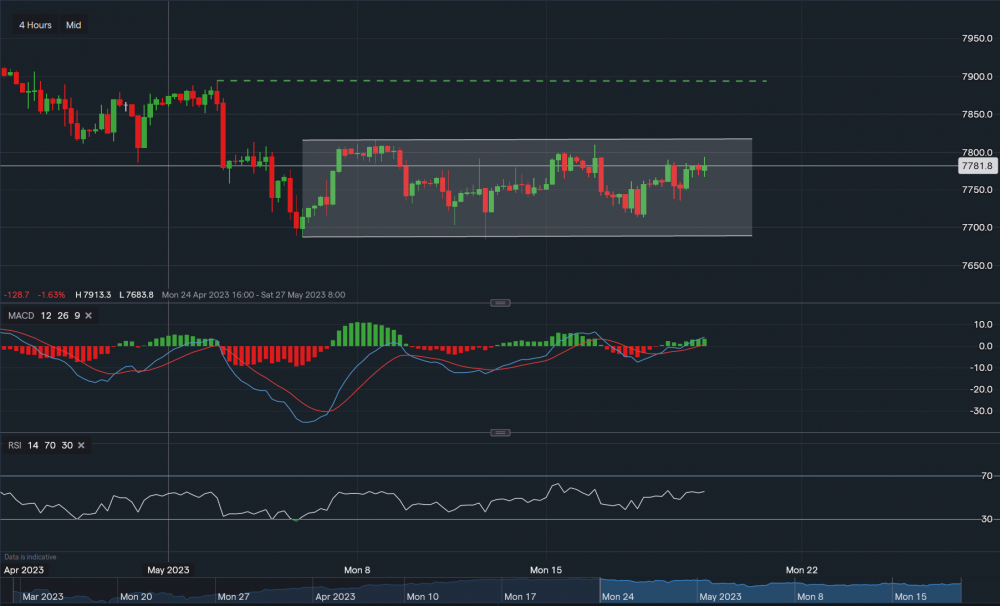
Chart & Data from IG
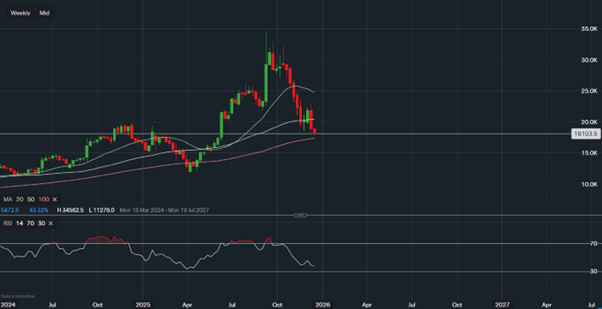
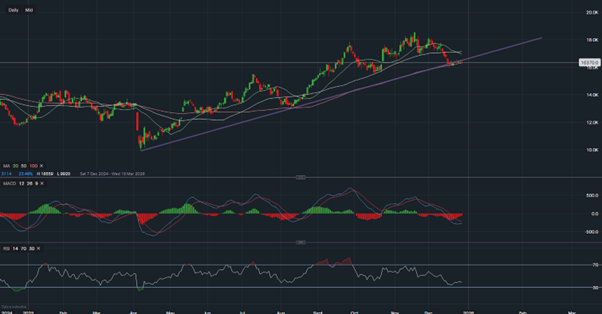
Taking a look at the FTSE100 on the futures ticket as it seems like it’s shaping up for a potential move higher. The index has found itself rangebound in the channel drawn on the chart, with the base support at 7, 683 and the resistance at 7, 815. A dip below 7,683 could see a further retracement towards 7, 620-7, 630, whereas a break above 7, 815, may see a move higher towards the green trendline. Or respectively, 7, 890-7, 900. The technical indicators are both currently positive with an RSI reading of 55. The daily timeframe also highlights the setup of a base with support for a move upwards, however, this could only be due to speculation and optimism carried from the US and Asian markets. Any positive movement is not guaranteed and investors/traders should always be aware of the risk-to-reward ratio, as well as placing stop losses as part of their trading regime.

(Source: IG.com Daily timeframe)

Tradable assets:
Min.Deposit:
Max Leverage:
FCA:

Rating:
 Earnings Calendar
  Economic Calendar
  VAT Calculator
  Tax Free Childcare Calculator
 Percentage Calculator
 Compound Interest Calculator
  Loan Overpayment Calculator
 Mortgage Calculator
 Credit Card Calculator
 Investing
  Economics
 Trading
  Technical Analysis
  Personal Finance
 Calculator