Test draft sch f
$11
13 Feb 2026, 12:42
Neutral

Join Minipip Academy and access free courses in investing, trading, economics, and more.
Sign Up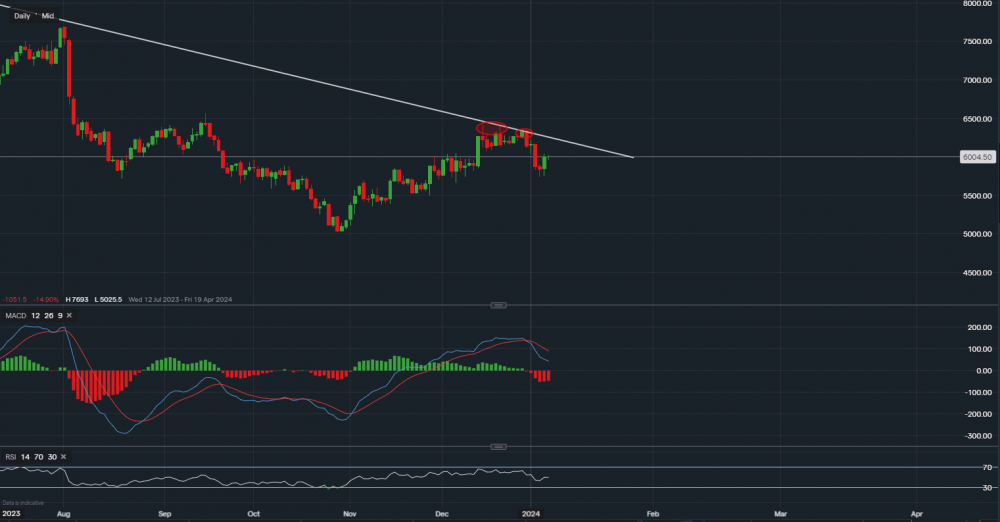
Chart & Data from IG
Taking a look at PayPal as yet another rejection has occurred along the descending trendline, which dates back to April of 2022. Currently, its share price sits around $60.04 a share. Looking at the chart from a technical aspect and based on a daily timeframe, we can see that the price was rejected in the range of $63.46-$64.11. This is highlighted by the two red ovals. Due to the overpowering resistance, the price has now retraced back to its current level. However, we can see that last Thursday a minor support level was formed, reading $57.44. The following day saw an engulfing candlestick, which tends to be a bullish indicator. Hence, over the next week or two we may see yet another attempt on the trendline resistance for a potential breakout. The resistance in focus now is $61.96 (along the trendline). As already mentioned, the support in focus is now $57.44. A break and close below it would signal that the momentum may have faded and further downside is possible. In that scenario, the focus would shift to support levels of $56.62 followed by $55.05. Looking at the technical indicators, the MACD has now turned negative due to the rejection but the RSI is neutral as it reads 49.

Tradable assets:
Min.Deposit:
Max Leverage:
FCA:

Rating:
 Earnings Calendar
  Economic Calendar
  VAT Calculator
  Tax Free Childcare Calculator
 Percentage Calculator
 Compound Interest Calculator
  Loan Overpayment Calculator
 Mortgage Calculator
 Credit Card Calculator
 Investing
  Economics
 Trading
  Technical Analysis
  Personal Finance
 Calculator