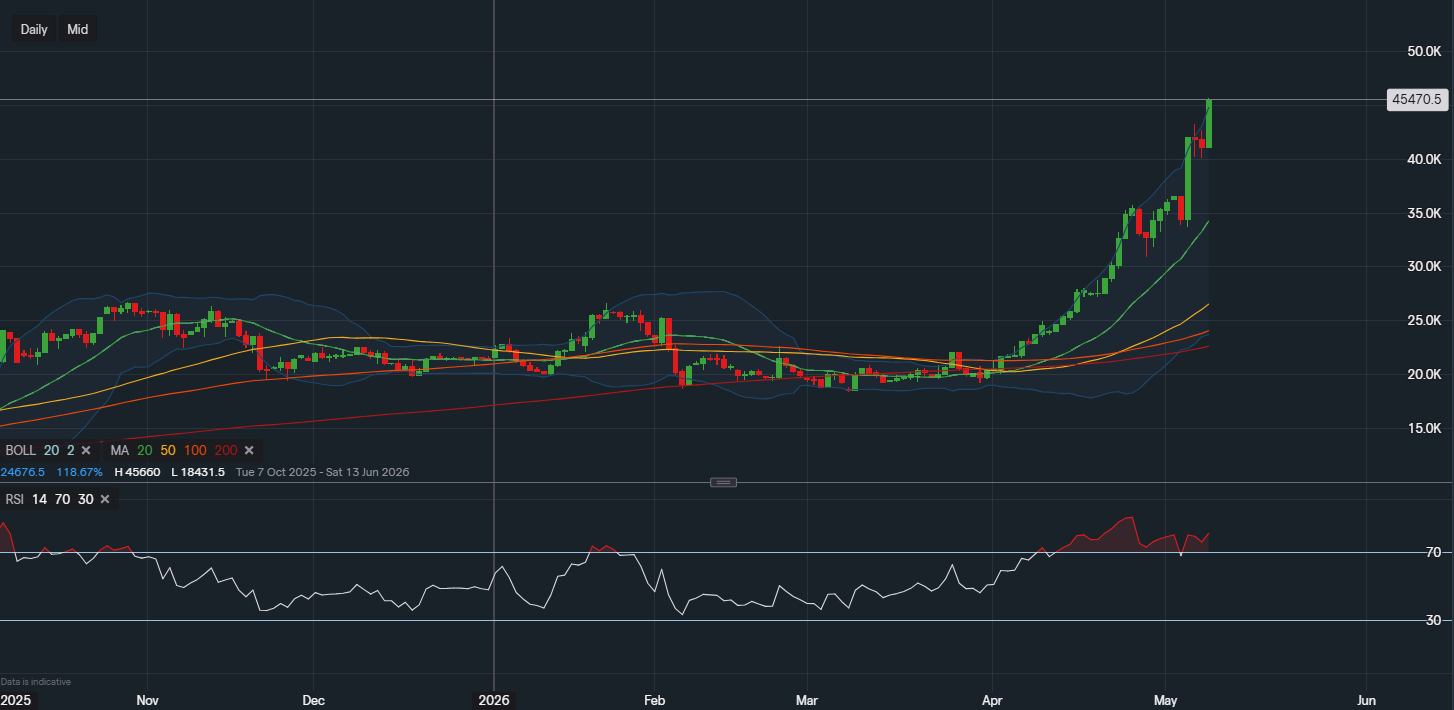
AMD Stock Analysis: Bullish Momentum Continues, but Is a Pullback Coming?
$454.71
09 May 2026, 13:49
Bullish

Join Minipip Academy and access free courses in investing, trading, economics, and more.
Sign Up
Oil - Chart & Data from IG
Technicals
Taking a look at the US Crude in this instance, it is currently trading at around $78.97 a barrel. Applying the Fibonacci retracement to the chart, we can see the price of oil has been a bit wavy since the 12th of December 2022, but still remains in a slight uptrend. At present, minor resistance sits at $79.03 (38.2% Fib) whereas the resistance major rests at $81.69. The major has been tested a couple of times in the new year, but there wasn’t any clear breakthrough or closing price above. Therefore, this tough resistance at $81.69 (50% Fib) remains as the key level that needs tackling before any further upside occurs. In the meantime, support sits at $75.75 (23.6% Fib) then a key point at $70.43. A break below $70.43 could see a continuation of the bearish trend oil experienced in 2022. Looking at the technical indicators, MACD is negative but RSI is neutral as it reads 49.
 Earnings Calendar
  Economic Calendar
  VAT Calculator
  Tax Free Childcare Calculator
 Percentage Calculator
 Compound Interest Calculator
  Loan Overpayment Calculator
 Mortgage Calculator
 Credit Card Calculator
 Investing
  Economics
 Trading
  Technical Analysis
  Personal Finance
 Calculator